KEY PERFORMANCE INDICATORS (KPIs)
Published on:
Monday, January 22, 2024
By Aidan Steinbach
KEY PERFORMANCE INDICATORS (KPIs)
For a moment, imagine that you walked into a gym and all the weights were unlabeled. They were all the same size and shape with no numbers. How would you go about ensuring that you achieve your goals? You would probably record everything you do with terrific detail, attempting to remove as many unknowns as possible. Even then, consistent, reliable progress would be anything but assured. That is to say, you need simple quantifiable measures to link goals to work. Let's apply this same analogy to business.
*If you don't know your numbers you won't grow your numbers.*
The way you "label weights" in business is through the use of KPIs. These indicators will keep an active pulse on the organization and can be broken into three main categories.
1). Outcome: As the name would suggest, this bracket shows what the machine is producing and not how it is being produced. Usually seeing your revenue to date is not relevant to daily operations, but it is critical when making medium to long-term decisions. Gross revenue, profit ratios, debt-to-income statements (liquidity ratios), aggregate customer satisfaction, and return on ad spend (ROAS) would all slot into this layer.
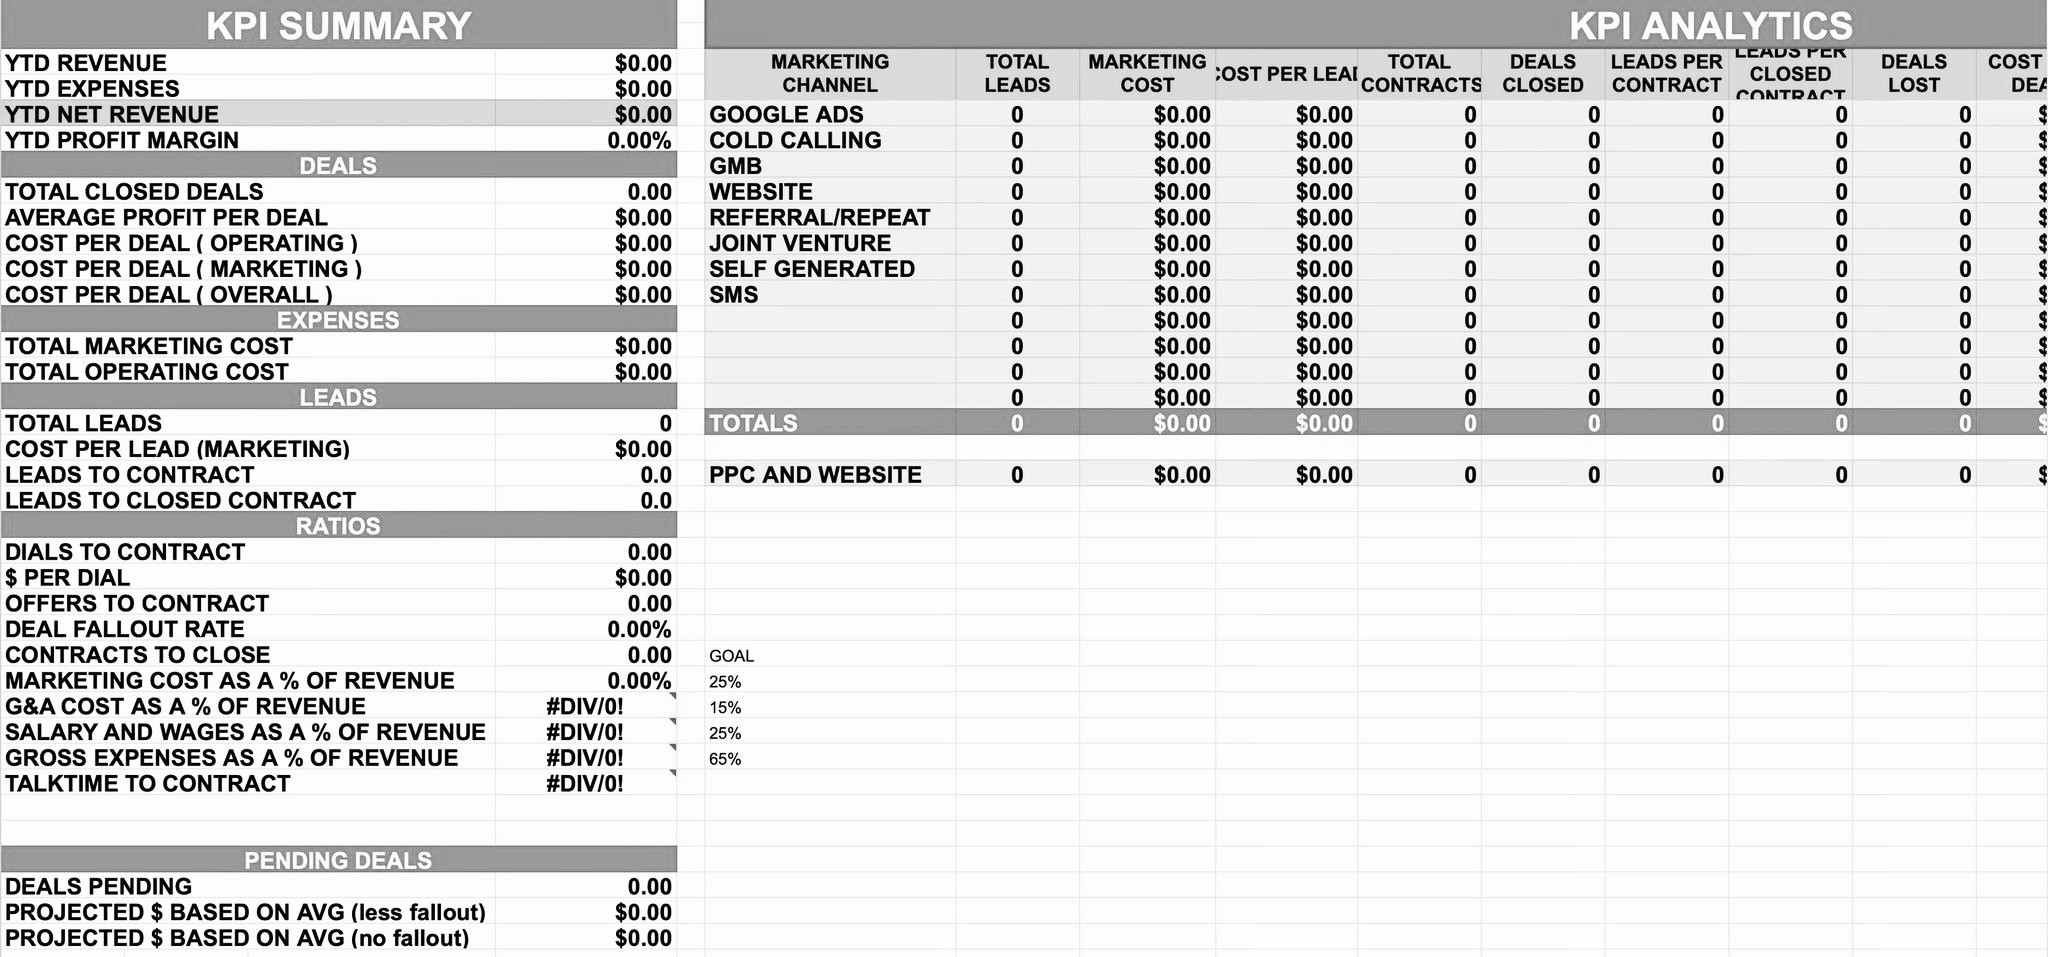
2). Process: Outcome data is to process figures what weight is to total caloric intake. This tier of information is what will drive short-term decision-making. What is tracked will be largely dependent on the industry you are in. Below is a screenshot of my KPI Scorecard to give you an idea of what we tracked. For the most part, many businesses are going to be the same. Fiscally speaking tack, pending deals, deal fallthrough rate, customer lifetime value (CLV), customer acquisition cost (CAC), cost per lead (CPL), and cost per dial/text, etc. Performance-wise, track, dials to lead, offers made, offers to deal, leads to deal, and dials to deal. Whew, that was a mouthful, but everything there is important and will give you a good objective picture of where your company is and where it should be going. Tracking all this will also give an unbiased yardstick by which employees are judged, and rewarded.
3). Structure: Structure describes the infrastructure of your organization. This will be less relevant to those in the startup stages. Outside of you, this would include information like the number of performing and nonperforming sales reps, rate of absenteeism, and employee turnover. If you are a one-man band, you can still use this as an opportunity to track, days worked, hours per day, hours per week, and use this as a metric for gauging productive capacity.
By now you may be thinking that all this sounds very complicated to keep tabs on. That is where technology comes in, namely in the form of a CRM or customer relationship manager. Think of a CRM as a private website for your company that serves as a process map of sorts. I used Podio for mine and spent many many hours coding it to look and do what I wanted. In the end, it would automatically tell me when people needed to be followed up with and feed me real-time data about my sales pipeline.
From there the information needs to be formatted into an Excel spreadsheet at the end of each business day. The spreadsheet can be as simple or complex as you would like for it to be, but it's well advised to keep things simple in the beginning. Complicated spreadsheets are not what make companies hugely profitable, work does. Don't confuse causation with correlation.
**A Note on Revenue Projections*
It can be very tempting to begin extrapolating one-off numbers into monthly projections. These predictions are nothing more than guesstimates. Initially, the best advice when not starting with funding is to reverse engineer your output with lower-end industry average KPIs.
I will leave you with a quote from the renowned statistician and economist Edward Deming.
"Without data, you're just another person with an opinion."